When was the last time you mailed a report to a c-suite executive only to find later that the report was never opened? As marketers, we are aware that the average attention span is 8 seconds. Yet when it comes to reporting, we rely on Excel sheets and PowerPoints.
For the analytics team creating a report means scoping and gathering data from hundreds of sources. So with a countless number of hours spend on the activity you really don’t want the effort to be a futile activity. Microsoft Power BI allows you to create beautiful reports and dashboards on the fly which can be consumed on the web and across devices. Power BI allows you to connect to hundreds of data sources, simplify prep and perform ad-hoc analysis.
With Power BI for Digital Marketing, your team will discover new possibilities as they understand how their work influences and coincides with other activities within the marketing eco-system. So how do you get started with Power BI for Digital Marketing and what are the use cases for marketers?
Power BI for Digital Marketing: Getting Started
Whether it is a simple excel sheet or a collection of cloud-based applications, Power BI lets you easily connect to your data source allowing to create a visually immersive experience.
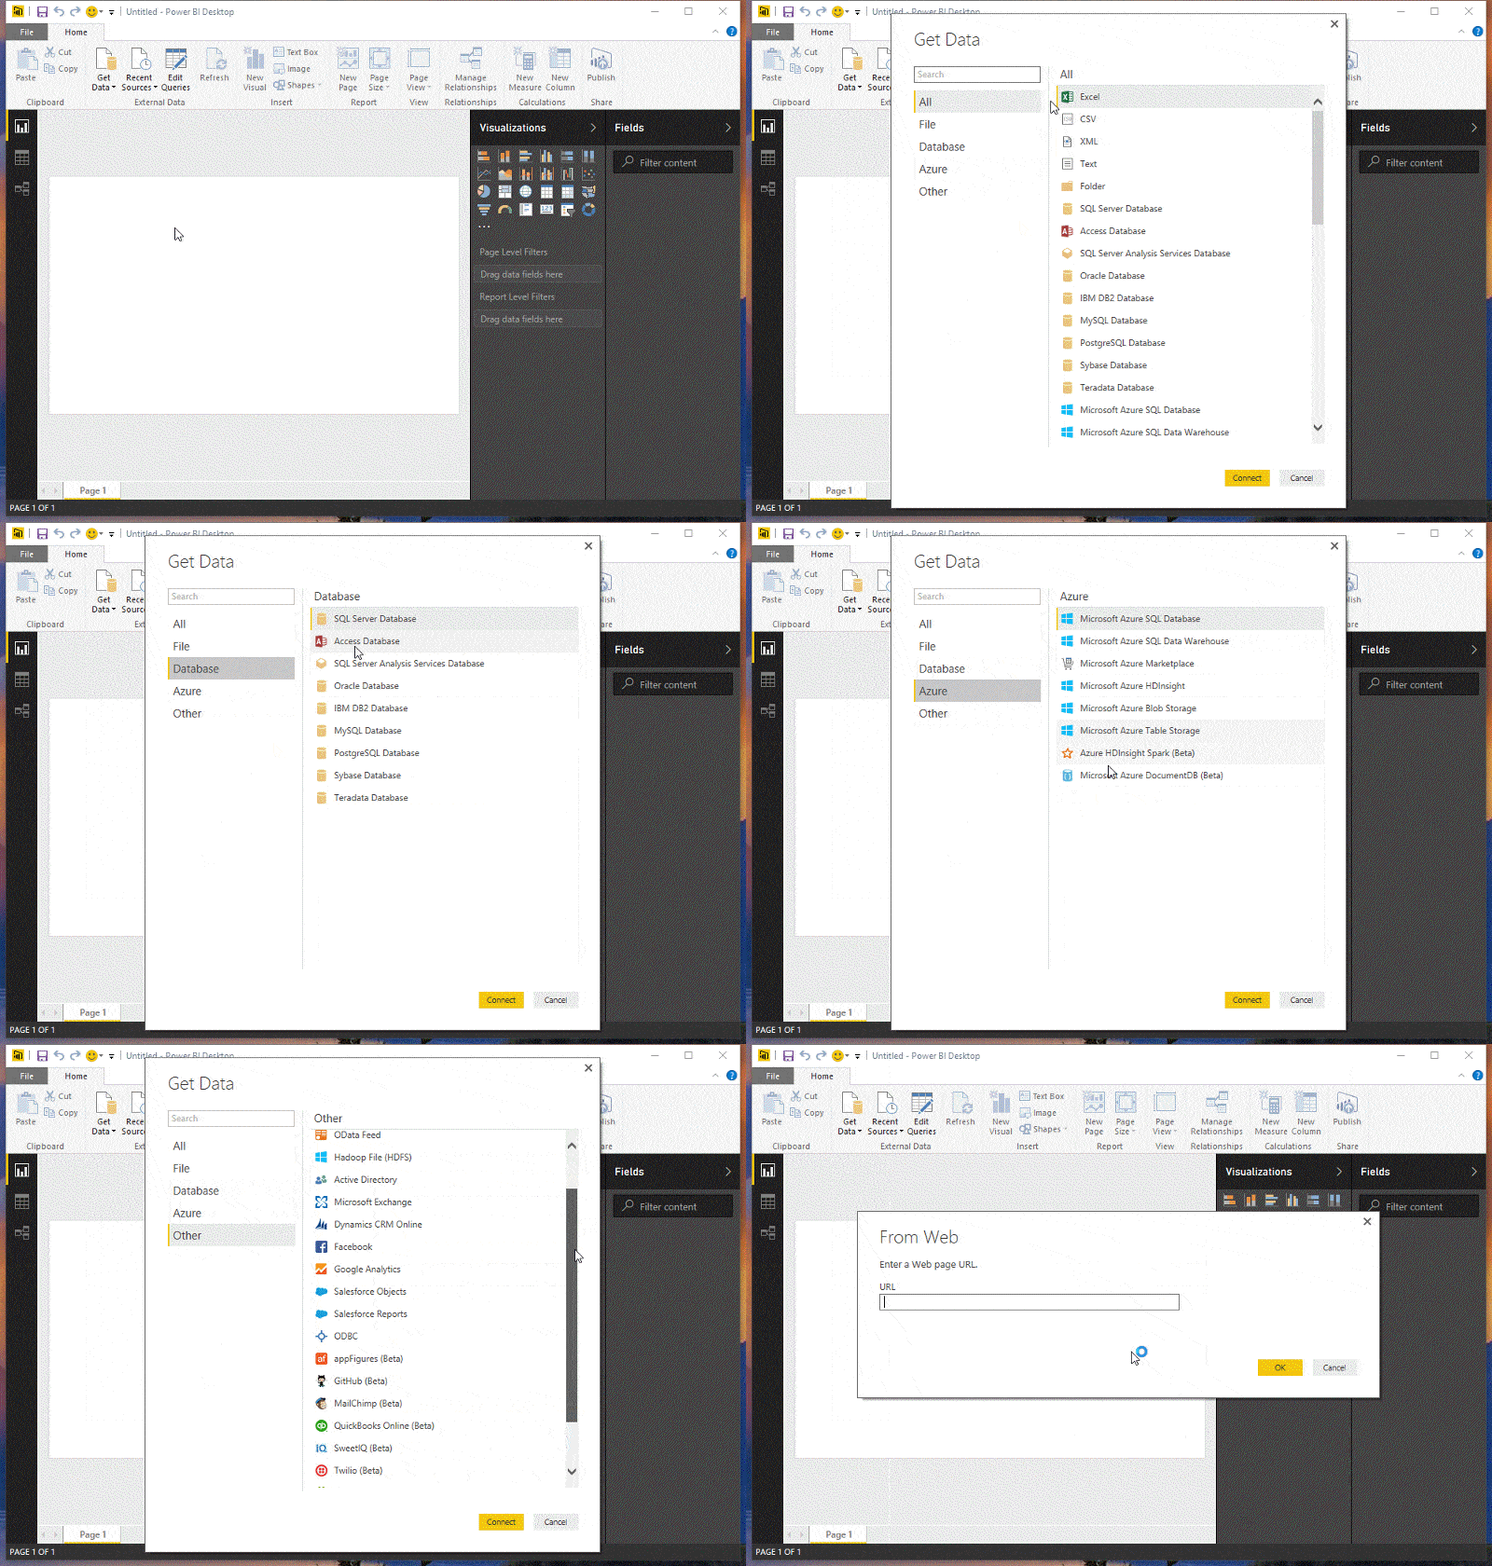
Getting Data
To get started with Power BI you need to bring your data to Power BI. Once you upload the data to Power BI either using a file or service, it will be presented under Datasets tab. Dataset is a collection of data that the platform uses to create a visualization.

A dataset can contain data from multiple sources. For example, you can create a dataset from four different database fields, one website table, paid campaign data exported from your AdWords account, an excel table, and online results of an email campaign. Power BI has built-in connectors to export data from services like Facebook, Salesforce, MailChimp, etc.
Once you have exported the data, you can perform basic transformations using the query editor. Query editor allows you to perform a whole range of activities like remove/edit columns and rows, change type, transpose columns/rows, etc. The query editor allows you to clear irregularly formatted data and also perform powerful data transformations like append or merge queries.
Modelling
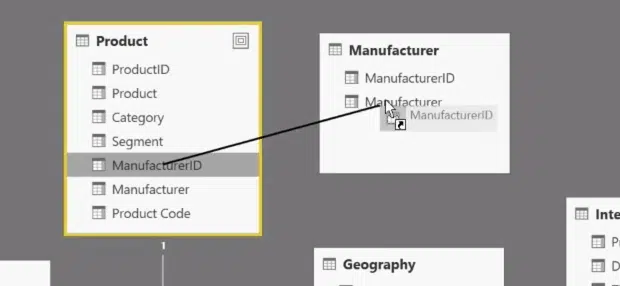
Once you have connected data from different sources, you’ll need all of this data to work together. Modelling helps you create a logical connection between various data sources. Power BI refers to this connection as a relationship.

Relationship between data sources enables Power BI to know how different tables relate to one another. Relationship view on Power BI Desktop provides a diagrammatic view of your data with each block representing a table and its columns, and lines between them represent relationships. You can also select Manage Relationship section under the home tab and select Autodetect to find relationships in new or updated data.
Manage Relationship section also enables you to set the cardinality. The options included under Cardinality are Many to One, and One to One. Many to One is the fact-to-dimension type relationship, for example, a marketing table with multiple rows per product being matched up with a table listing channels in their own unique row. One to One is used often for linking single entries in reference tables. Power BI doesn’t support many-to-many relationship.
Visualization

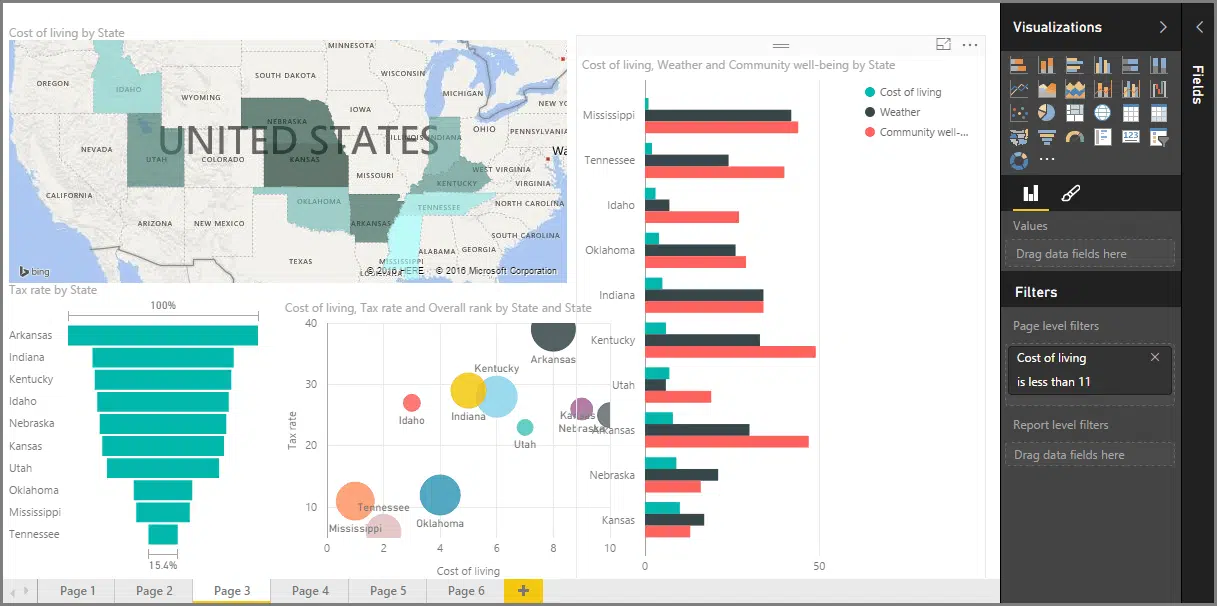
Power BI provides a whole range of visualizations right from simple bar charts to pie charts. To create the visualization you can drag the field names from fields plane and drop them into the report canvas and choose the type of visualization.
You can enhance the interactivity further by adding an on-canvas visual filter like a slicer. This allows anyone looking at the data to segment data by a particular value. Gauges and cards can also to improve interactivity.
Power BI for Digital Marketing: Use Cases
Power BI allows you to co-relate marketing metrics from different sources, and it also removes the possibilities of having false positives from your data. Power BI helps you to create dashboards on the fly by connecting with services like MailChimp, Google Analytics, etc.
Measuring Paid and Organic Data with Power BI for Digital Marketing
With Power BI you can combine your organic and paid data to gather insights and identify new opportunities. For example, you can compare your paid keywords vs, organic keywords to identify your estimated CPC shared by SEMrush and actual CPC incurred using AdWords. Here is a video from Will Reynolds, Founder of Seer Interactive, demonstrating how to create a relationship between your paid and organic data.
Social Media Monitoring & Analytics with Power BI for Digital Marketing
Power BI can also be used to create dashboards for social media monitoring and analytics. For example, the social media monitoring dashboard from Cheetos has helped the brand to understand sales, product’s quality, crisis control and understand the audience opinion about the product.
Keyword Analysis with Power BI for Digital Marketing
The real value of Power BI is how it helps you in doing an ad-hoc analysis. For example, you want to showcase how many distinct search terms you have in your keyword database and how many keywords have more than 50 conversions. You can use a scatter chart with a slicer to showcase the values to your clients.
With Power BI for Digital Marketing, your data will drive conversations. Combining data from different sources will reveal insights that aren’t available in siloed data. If you are new to Power BI, we recommend that you start by reading the Power BI starter’s guide or by viewing the courses offered by Microsoft Virtual Academy.
