

American engineer & statistician, W. Edwards Deming said, “In God we trust; all others bring data.” Data helps you discover the known unknowns. Known unknowns need careful examination to move from hypothesis to fact. When it comes to finding insights from data, Google Analytics is a marketer’s holy grail. Over 51% of Fortune 500 companies trust the tool when it comes to finding insights from data. Yet when it comes to Google Analytics reporting marketers have a long way to go.
Google Analytics Reporting Best Practices
Start with a measurement plan
Effective reporting starts with a well-defined measurement plan. To measure your website’s effectiveness, you need to be clear about your objective, key performance indicators, and measurable metrics.
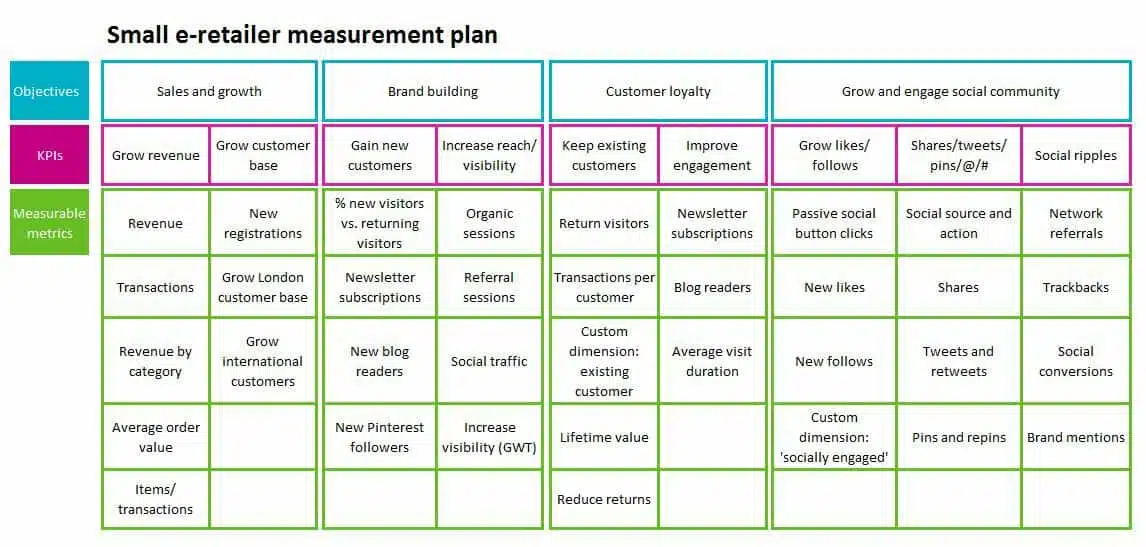
Google Analytics Reporting should never follow a one size fits all approach. Each stakeholder should be provided a drill down view depending on their role in the value chain. For instance, the c-suite executives will be more concerned with business metrics while webmaster would need a granular view of the data.
Create Events to Track Interactions
Events track user interactions with content on a web page or a screen load. Event tracking has four components:
- Category
- Action
- Label (optional, but recommended)
- Value (optional)
For instance, you want to track how many times a user downloaded a file. You could use:
- Category: “File”
- Action: “Downloaded”
- Label: “e-book”
You can also use an additional parameter to define an event as ‘non-interactional.’ In such case, the click from the event will not be counted in the calculation of bounce rate. To learn more about the best practices of event tracking do check our list here.
Segment your data to uncover insights
A segment is a subset of your analytics data. For instance, of your entire set of users, one segment might be of users from a certain geography or city. Another segment could be of users who visit a certain section of the website.
Segments help you to isolate and analyze subsets of data to identify new trends and patterns. Google analytics offers default and custom segments. Default segments are pre-packaged segments provided by Google. Custom segments allow help you in creating your own segments.
For instance, if you want to filter out referral spam from your website data. You can create a new segment under referral traffic use conditions to exclude spam URL websites.
Use Analytics Intelligence
Analytics Intelligence uses machine learning to help marketers better understand and act on data. Analytics intelligence assists you by:
- Answering questions structured around metrics and dimensions.
- Building audience and conversion models using smart goals, smart lists and session quality.
- Discovering insights from your data in case of major changes or opportunities.
Track Conversions Using Goals & E-Commerce Tracking
Conversions track completion of an activity that is crucial to your business. For instance, a user signs up for a newsletter or makes a purchase. To track conversions, you need to set-up goals or implement e-commerce tracking.
You can set-up macro goals to track conversions for e-commerce transactions or lead generation activities. Macro goals should be aligned with the primary objectives of your website. You can also set-up Micro goals that track other activities that contribute to primary conversion.
Once you have set-up the goal, visualize your traffic using goal flow report to understand how the user behaves on your website. Goal flow reports highlight any unexpected loops or drop-offs in the journey to help you take corrective actions.
E-commerce tracking enables you to analyze purchase activity on the website. For e-commerce tracking, you can use tag manager or set-up cross domain tracking. E-commerce tracking allows you to track revenue, conversion rate, transaction details and marketing effectiveness for campaigns.
Combine Data from Search Console
Google Analytics allows you to integrate data from Search Console and AdWords Manager. Search console data can be integrated with analytics data using the landing page dimensions.
You can use the dimension to view pre-click data including queries and impressions correlate it with post-click data like bounce rate and transactions. Search console data in analytics uses four metrics: impressions, clicks, average position and CTR.
Create Filtered Views
Google Analytics provides filters that allow you to limit or modify the data that is included in a view. For instance, you can filter to exclude traffic from internal IP addresses. You can create filters at the account level and also apply them to one or more views.
Google analytics currently provides eight types of filters include and exclude filters, search-and-replace filters, advanced filters, exclude internal traffic, filter domain referrals, filter on geography, custom filter fields and social network filters.
Effective Reporting Ends With Action
Wouldn’t it be fantastic if Google Analytics could fix all your problems for you? But unfortunately, it doesn’t, people do. Insights don’t hold any value if they are not translated into action. Sometimes the smallest of the changes will result in huge difference when it comes to traffic and engagement. Effective Google Analytics Reporting starts with actionable insights.
